
2024 Global Market Outlook
Balancing Market Risks in 2024
Balancing Market Risks in 2024
The pivot markets have been waiting for! The Federal Reserve’s pivot away from combating inflation and towards stabilizing employment is underway. Why? Inflation is coming down headlined by reductions in wage growth and shelter. Indeed, the US economy continues to expand at a rate of 2%-3% per year, and robust consumption figures persist. However, a closer examination reveals that some underlying weaknesses are starting to emerge.
Market Index Performance
As of 8/31/2024 (JP Morgan Weekly Market Recap)Earnings estimates are coming down and revenue projections are lagging expectations. Furthermore, unemployment has increased, and job openings are coming down. According to the Federal Reserve, the greatest risk would be a scenario where individuals start believing that the job market is deteriorating, leading them to curtail their spending.
Our approach continues to be ‘stay alive and look for the ball’. That sports analogy is a perfect way to explain investment management in today’s economy. We expect significant divergence in asset classes and within different sectors. Tactically, it’s certainly desirable to be in the market for potential gains, but it is equally important to thoughtfully manage portfolio risk.
Scott Tremlett, CIMA®, CFP®, ChFC® | Managing Partner / Chief Investment Officer
Allocation Update1
| US Equity: | Overweight |
| Developed Int'l Equity: | Overweight United Kingdom; Underweight Japan; Underweight Europe |
| Emerging Markets Equity: | Overweight India; Underweight China; Underweight Brazil |
| US Government Bond: | Underweight |
| US Corporate Bond: | Neutral |
| International Bond: | Underweight |
| Emerging Markets Bond: | Underweight |
| REIT/Commodity: | Underweight |
| Alternative Assets: | Overweight |
| Preferred Sectors: | Financial Services, Industrials, Technology |
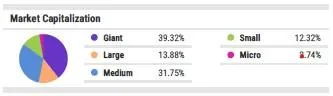
Equity Exposure: Top Holdings1
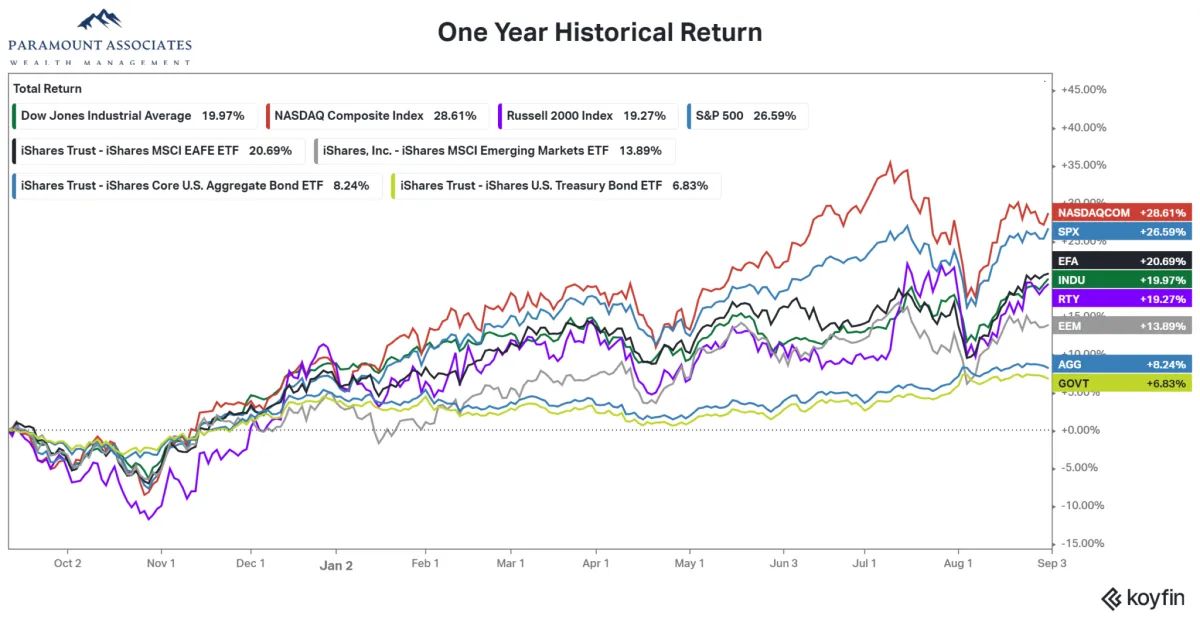
One Year through 8/31/2024 – Nasdaq, Dow Jones Industrial Average (INDU), Russell 2000 (RTY), S&P 500 (SPX), Developed International (EFA), Emerging Markets (EEM), Aggregate Bond Index (AGG), US Treasuries (GOVT).
2024 Scorecard & Macro Themes
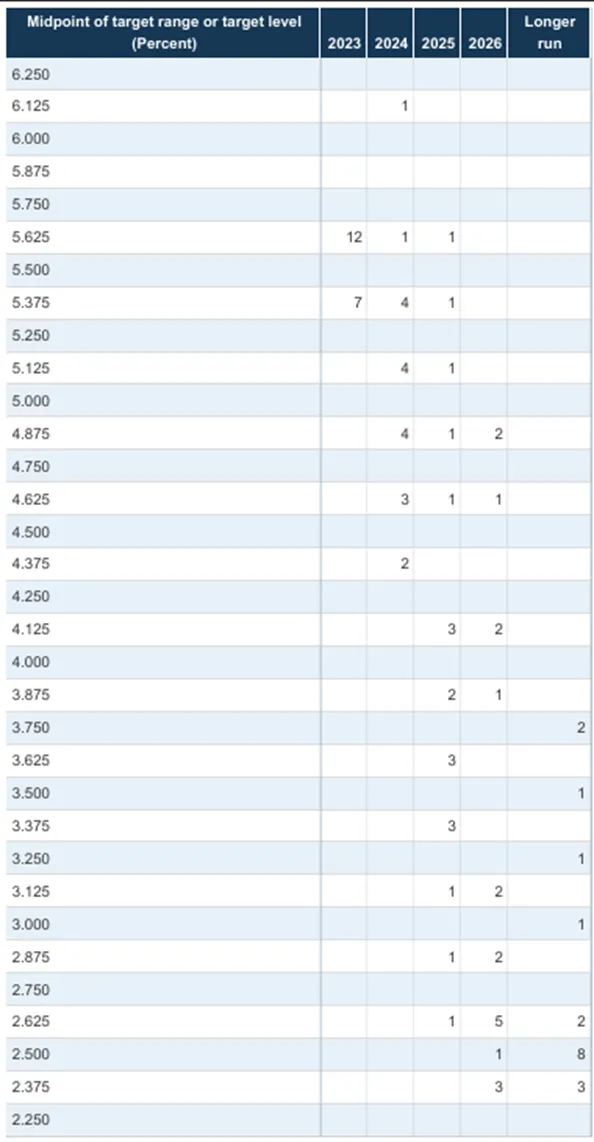
(1) Federal Reserve Will Not Cut Interest Rates Until Summer 2024
Markets began 2024 expecting six quarter-point rate cuts. The economy exhibited unexpected strength, job availability was abundant, and inflation persisted. Considering the Fed lowers rates to assist slowing economics or prevent job losses, we did not see a reason to reduce rates until cracks began to show.
(2) Earnings Growth in the US Will Not Hit Double Digits in 2024
Q2 2024 earnings per share growth rate came in at 11.3%, driven by mega-cap technology and AI spend. Revenue growth, however, has begun to slow, and Q3 earnings estimates have seen downward revisions since June.
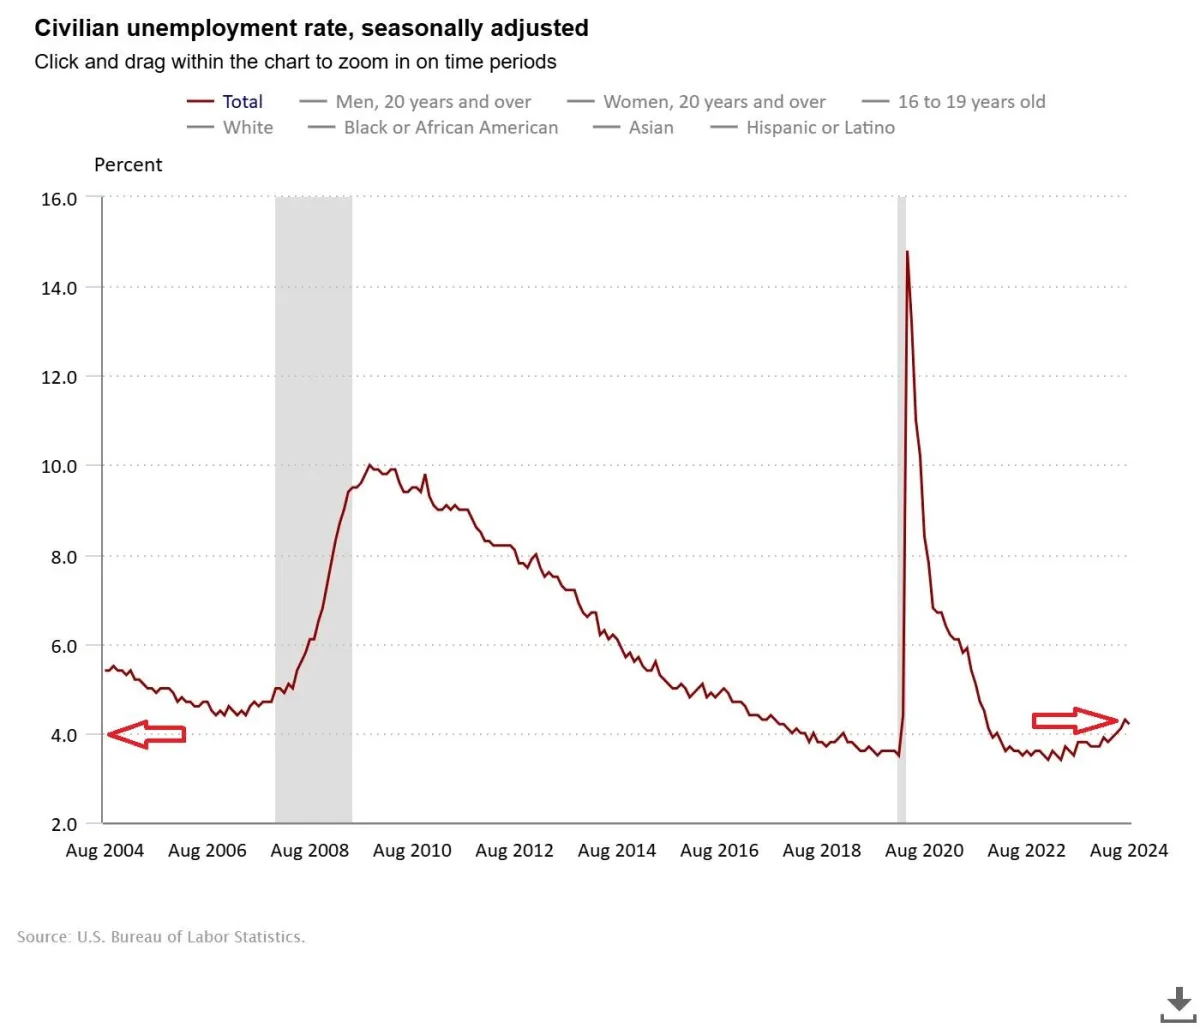
(3) Unemployment in the US Will Increase Above 4%
For the first time since the pandemic, wage growth is now lower than the unemployment rate. Employers are demanding more from their current workforce rather than expanding headcount rapidly.
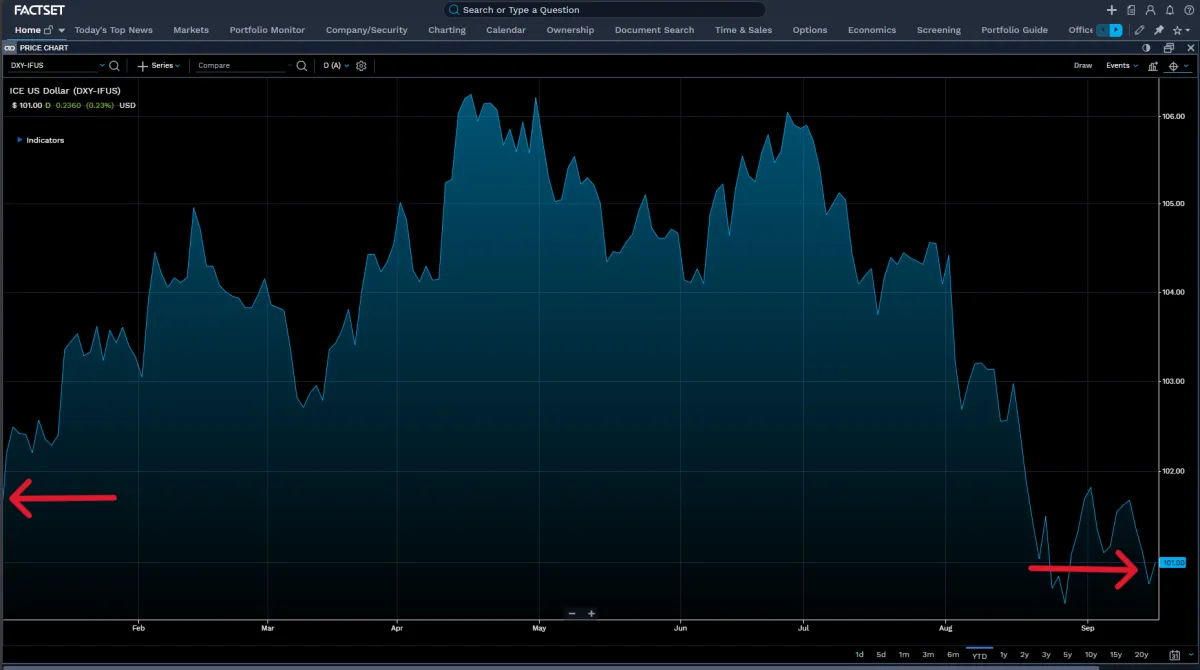
(4) The US Dollar Will Weaken
Interest rate differentials and monetary policy pivots around the globe are driving currency realignments.
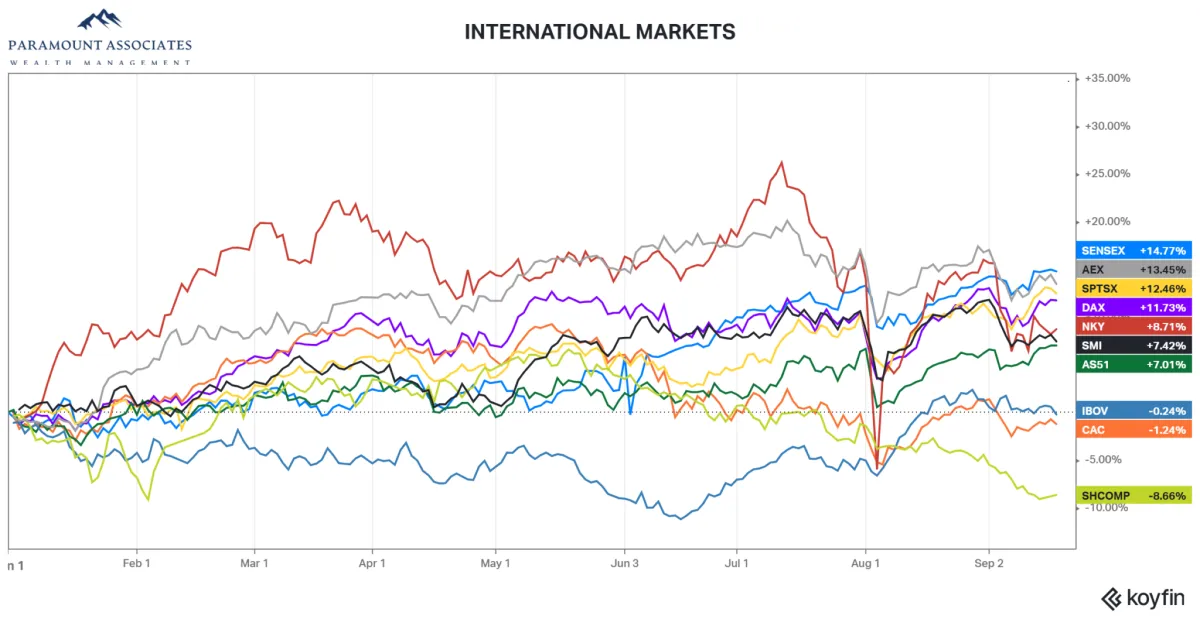
(5) International Stocks
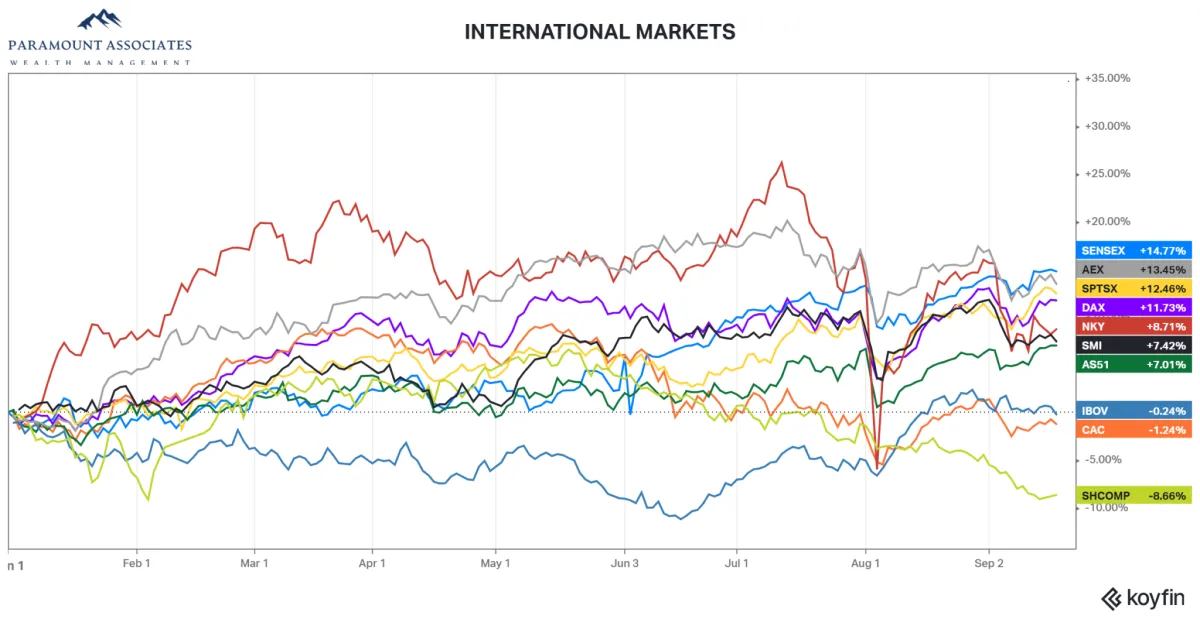
Emerging market leadership is prominent, with India and the UK outperforming broader benchmarks.
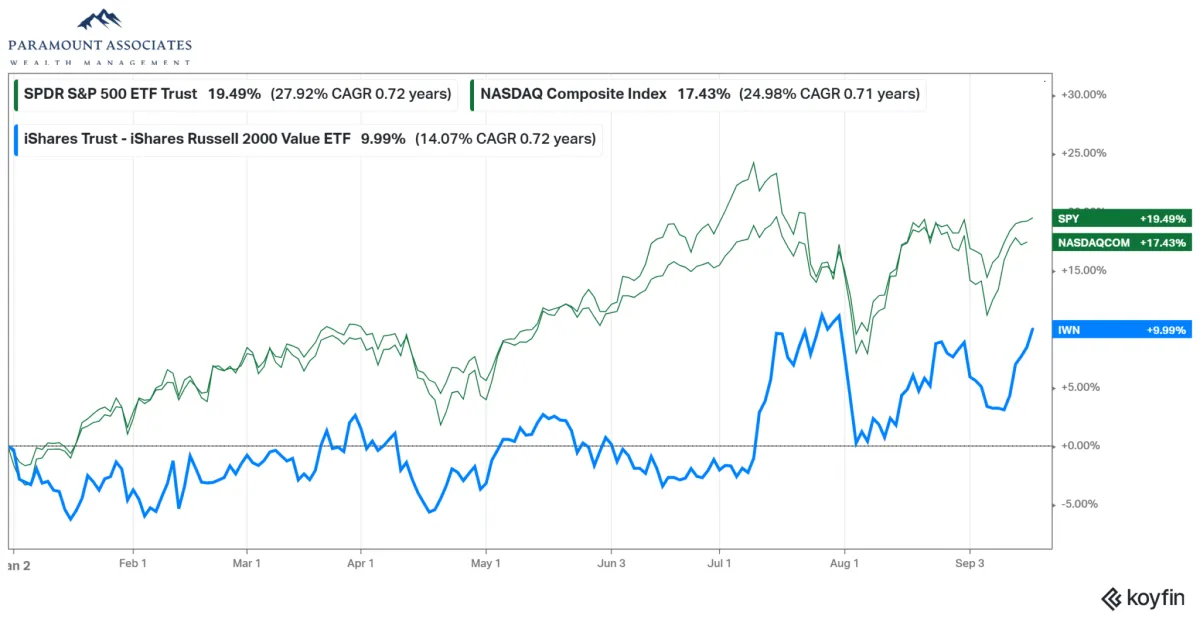
(6) Small Caps vs Large Caps
Slowing revenue growth and elevated debt borrowing costs constrain small caps relative to quality large caps.
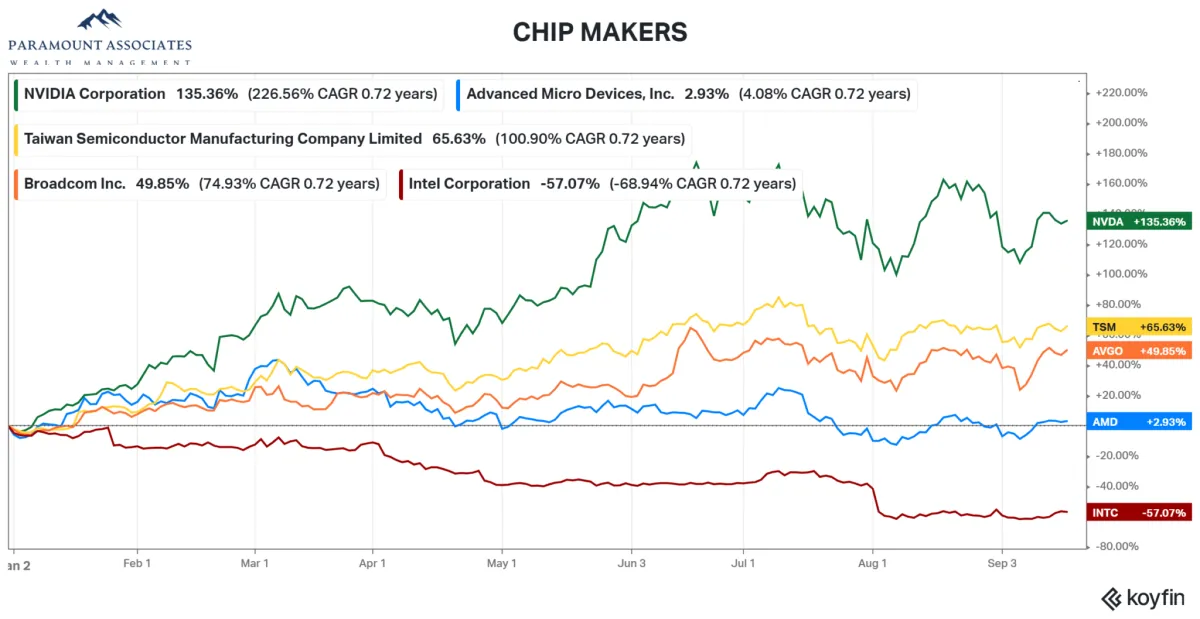
(7) Active Management & Wide Disparity Between Winners and Losers
Massive divergence exists within semiconductor firms (e.g. NVIDIA vs Intel) and country indices globally, reinforcing the need for active stock selection over passive index hugging.
REFERENCES
- YCharts, Portfolio Allocation Overview, accessed 2/01/2025
- United States: Employment Situation, Average Hourly Earnings – Econoday
- Personal Income and Outlays, PCE Price Index – Bureau of Economic Analysis
- United States: CPI, Bureau of Labor Statistics
DISCLAIMER
The views expressed represent the opinion of Paramount Associates Wealth Management. The views are subject to change and are not intended as a forecast or guarantee of future results. Past performance is not indicative of future results.